RECENT NEWS

Table of Content

Why India Wasted 747 GWh of Solar Power in May 2026 (The Storage Problem)

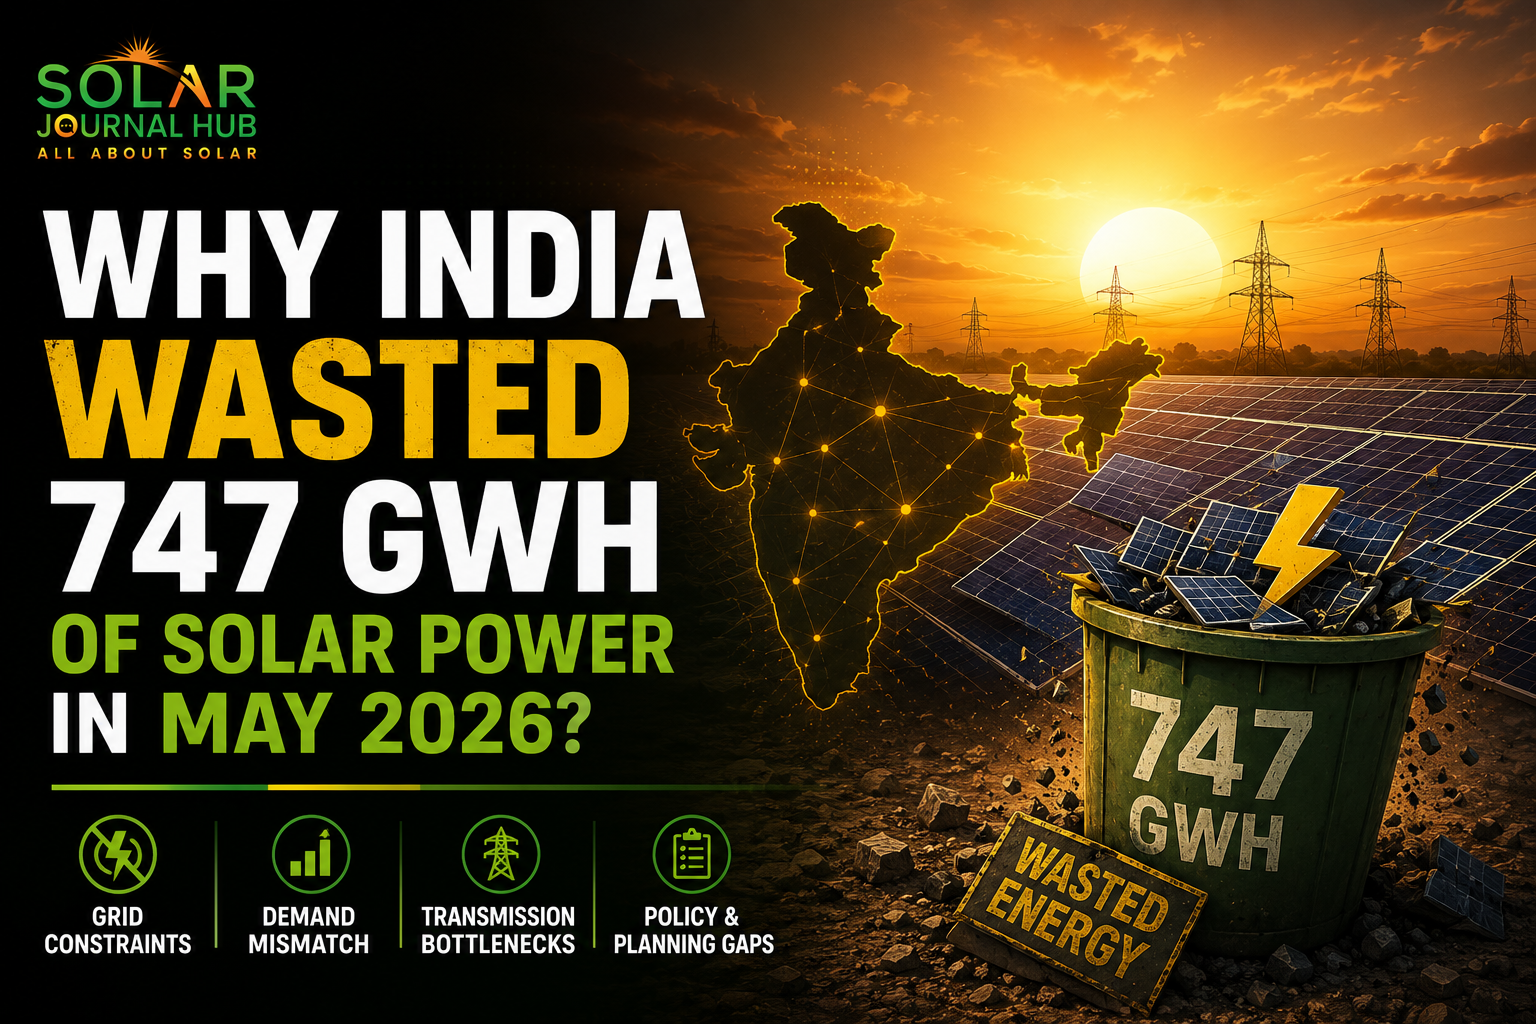
India’s solar story has always been told through capacity numbers. More gigawatts installed, more records broken, more sunlight converted into electricity than ever before. May 2026 exposed a different, less flattering number: roughly 24 GWh of solar power went unused every single day that month, adding up to nearly 747 GWh over 31 days. That is enough electricity to power more than a quarter of Delhi for an entire month, simply thrown away.

This is not a generation problem. India’s panels worked exactly as designed. It is a timing problem, and increasingly, a storage problem.

What Actually Happened in May 2026

A working paper from the Economic Advisory Council to the Prime Minister, authored by economist Sanjeev Sanyal and IRS officer Satvik Dev, laid out the problem in stark terms. During the day, solar floods the grid with cheap power. On the Indian Energy Exchange, day-ahead prices in May 2026 averaged around Rs 1.11 per unit at midday. By night, once the sun sets and demand from lighting, cooling and appliances climbs, the same unit of power cost close to Rs 9.71.

That is nearly a ninefold price swing within a single day, and it captures, in one statistic, exactly why solar curtailment keeps rising even as installed capacity grows.

The paper also pointed to a widening gap in the grid’s daily rhythm. Between May 2023 and May 2026, the morning drop in net load as solar output ramps up nearly tripled, from 18.5 GW to 52.6 GW. Over the same period, the evening surge in demand once solar fades nearly doubled, from 35.7 GW to 73.7 GW. Grid operators call this shape the duck curve, and in India’s case, it is getting steeper every year.
The Numbers Behind the Curtailment

  • Average daily solar curtailment in May 2026: about 24 GWh
  • Total curtailment over the month: roughly 747 GWh
  • Evening demand shortages recorded on 36 out of 61 days across April and May 2026, compared to just 6 days of shortage during solar hours
  • Flattening even half of a typical summer evening ramp would need about 130 GWh of battery discharge between 1 pm and 8 pm
  • India’s entire pumped-storage and battery fleet discharged only about 23.8 GWh on an average day in May 2026

Put simply, the grid needed roughly five to six times more storage discharge than was actually available on a typical day.

Why This Is a Storage Problem, Not a Generation Problem

India is not short of electricity. The paper makes this point directly: the stress does not show up when the sun is shining. It shows up after sunset, when solar output disappears and conventional plants have to ramp up fast to fill the gap.

Coal plants, which still form the backbone of India’s conventional fleet, are not built for this kind of rapid cycling. Running them below full load through the day and then ramping them up sharply in the evening is both technically demanding and expensive. Every unit of solar curtailed at midday, followed by a costly coal ramp-up at night, represents a double loss: wasted clean energy and higher power costs passed down the line.

The 21 May 2026 data point illustrates this well. Peak electricity demand that day hit an all-time high of 270.8 GW at 3.45 pm, met in large part by solar. By 6.30 pm, as the workday ended and cooling and lighting loads kicked in, demand had swung back up sharply, forcing conventional plants into exactly the kind of rapid ramp that makes them expensive and inefficient to run.

Where the Storage Shortfall Actually Comes From

Battery storage is the most direct fix, and India’s own planning documents say so. Against a National Electricity Plan target of 8.68 GW of grid-scale batteries for 2026-27, only 0.27 GW was operational as of January 2026. Capacity has since grown to around 2.7 GW, which is meaningful progress, but still a fraction of what the plan envisioned.

Pumped hydro storage, by contrast, has nearly kept pace with its own target, reaching 7.2 GW against a projection of 7.45 GW. The gap, in other words, is not a general storage failure. It is specifically a battery build-out that has lagged far behind schedule, even as solar capacity additions have continued at pace.

Regional Patterns Worth Watching

Curtailment is not evenly spread across the country. Separate transmission-focused analysis for the first quarter of 2026 found:

  • The northern region accounted for the largest share of transmission-related curtailment, at 178 GWh
  • The western region followed at 122 GWh
  • The southern region recorded no transmission-related curtailment at all, reflecting better synchronisation between generation growth and grid expansion in that part of the country

Rajasthan and Gujarat, both major solar hubs, feature prominently in curtailment data, partly because their generation capacity has grown faster than the transmission and storage infrastructure needed to move and manage that power.

What Would Actually Close the Gap

Analysts point to a mix of near-term and structural fixes rather than a single solution.

  1. Faster battery build-out at pooling stations. Estimates suggest that 3 to 4 GW of two-hour battery storage placed at major grid pooling stations could absorb most of the curtailed generation currently being lost to transmission constraints.
  2. Regulatory clarity for storage. Giving storage systems clearer legal and commercial standing, including the ability to be procured as a transmission asset with costs shared the way transmission charges are, would make battery investment more attractive.
  3. Better use of existing transmission capacity. Technologies such as dynamic line rating and reconductoring can raise the carrying capacity of existing lines, buying time while new transmission projects catch up.
  4. Demand-side flexibility. Shifting flexible loads, industrial processes, irrigation, EV charging, toward daylight hours reduces the mismatch from the demand side rather than relying on storage alone.

None of these are exotic technologies. As the Ember report on transmission curtailment put it, the technical pieces are largely in place. What is missing is the pace of execution and the regulatory framework to move faster.

Frequently Asked Questions

Why is solar power being wasted if India still needs more electricity?

Because the timing does not match. Solar output peaks at midday when demand is comparatively low, and demand peaks in the evening when solar generation has already dropped to zero. Without enough storage to bridge that gap, surplus midday power has nowhere useful to go.

Analysts estimate that flattening even half of a typical evening demand ramp would require about 130 GWh of battery discharge across a single afternoon-to-evening window, compared with the roughly 24 GWh the entire national storage fleet discharged on an average day in May 2026.

No, but those states feature heavily in the data because their solar capacity has scaled faster than transmission and storage infrastructure. The southern grid, by comparison, has shown far better synchronisation between generation growth and grid readiness.

Most likely in the near term. India’s solar capacity additions are continuing at pace, cumulative renewable capacity crossed 282 GW by May 2026, while battery storage capacity, though growing, remains well below the levels the National Electricity Plan projected for this period.

The Bigger Picture

India’s renewable energy story is still, on balance, a success story. Solar capacity has grown from 58 GW in 2020-21 to over 157 GW by May 2026. But curtailment numbers like 747 GWh in a single month are a reminder that generation capacity alone does not solve the energy problem. What happens between the moment power is generated and the moment it is actually consumed now matters just as much as how much of it India can produce.

The next phase of India’s solar growth will likely be judged less by how many gigawatts get installed, and more by how much of that generation the grid can actually put to use.

Yushmita

Why India Wasted 747 GWh of Solar Power in May 2026 (The Storage Problem)

India’s solar story has always been told through capacity numbers. More gigawatts installed, more records broken, more sunlight converted into electricity than ever before. May 2026 exposed a different, less flattering number: roughly 24 GWh of solar power went unused every single day that month, adding up to nearly 747 GWh over 31 days. That is enough electricity to power more than a quarter of Delhi for an entire month, simply thrown away.

This is not a generation problem. India’s panels worked exactly as designed. It is a timing problem, and increasingly, a storage problem.

What Actually Happened in May 2026

A working paper from the Economic Advisory Council to the Prime Minister, authored by economist Sanjeev Sanyal and IRS officer Satvik Dev, laid out the problem in stark terms. During the day, solar floods the grid with cheap power. On the Indian Energy Exchange, day-ahead prices in May 2026 averaged around Rs 1.11 per unit at midday. By night, once the sun sets and demand from lighting, cooling and appliances climbs, the same unit of power cost close to Rs 9.71.

That is nearly a ninefold price swing within a single day, and it captures, in one statistic, exactly why solar curtailment keeps rising even as installed capacity grows.

The paper also pointed to a widening gap in the grid’s daily rhythm. Between May 2023 and May 2026, the morning drop in net load as solar output ramps up nearly tripled, from 18.5 GW to 52.6 GW. Over the same period, the evening surge in demand once solar fades nearly doubled, from 35.7 GW to 73.7 GW. Grid operators call this shape the duck curve, and in India’s case, it is getting steeper every year.

The Numbers Behind the Curtailment

  • Average daily solar curtailment in May 2026: about 24 GWh
  • Total curtailment over the month: roughly 747 GWh
  • Evening demand shortages recorded on 36 out of 61 days across April and May 2026, compared to just 6 days of shortage during solar hours
  • Flattening even half of a typical summer evening ramp would need about 130 GWh of battery discharge between 1 pm and 8 pm
  • India’s entire pumped-storage and battery fleet discharged only about 23.8 GWh on an average day in May 2026

Put simply, the grid needed roughly five to six times more storage discharge than was actually available on a typical day.

Why This Is a Storage Problem, Not a Generation Problem

India is not short of electricity. The paper makes this point directly: the stress does not show up when the sun is shining. It shows up after sunset, when solar output disappears and conventional plants have to ramp up fast to fill the gap.

Coal plants, which still form the backbone of India’s conventional fleet, are not built for this kind of rapid cycling. Running them below full load through the day and then ramping them up sharply in the evening is both technically demanding and expensive. Every unit of solar curtailed at midday, followed by a costly coal ramp-up at night, represents a double loss: wasted clean energy and higher power costs passed down the line.

The 21 May 2026 data point illustrates this well. Peak electricity demand that day hit an all-time high of 270.8 GW at 3.45 pm, met in large part by solar. By 6.30 pm, as the workday ended and cooling and lighting loads kicked in, demand had swung back up sharply, forcing conventional plants into exactly the kind of rapid ramp that makes them expensive and inefficient to run.

Where the Storage Shortfall Actually Comes From

Battery storage is the most direct fix, and India’s own planning documents say so. Against a National Electricity Plan target of 8.68 GW of grid-scale batteries for 2026-27, only 0.27 GW was operational as of January 2026. Capacity has since grown to around 2.7 GW, which is meaningful progress, but still a fraction of what the plan envisioned.

Pumped hydro storage, by contrast, has nearly kept pace with its own target, reaching 7.2 GW against a projection of 7.45 GW. The gap, in other words, is not a general storage failure. It is specifically a battery build-out that has lagged far behind schedule, even as solar capacity additions have continued at pace.

Regional Patterns Worth Watching

Curtailment is not evenly spread across the country. Separate transmission-focused analysis for the first quarter of 2026 found:

  • The northern region accounted for the largest share of transmission-related curtailment, at 178 GWh
  • The western region followed at 122 GWh
  • The southern region recorded no transmission-related curtailment at all, reflecting better synchronisation between generation growth and grid expansion in that part of the country

Rajasthan and Gujarat, both major solar hubs, feature prominently in curtailment data, partly because their generation capacity has grown faster than the transmission and storage infrastructure needed to move and manage that power.

What Would Actually Close the Gap

Analysts point to a mix of near-term and structural fixes rather than a single solution.

  1. Faster battery build-out at pooling stations. Estimates suggest that 3 to 4 GW of two-hour battery storage placed at major grid pooling stations could absorb most of the curtailed generation currently being lost to transmission constraints.
  2. Regulatory clarity for storage. Giving storage systems clearer legal and commercial standing, including the ability to be procured as a transmission asset with costs shared the way transmission charges are, would make battery investment more attractive.
  3. Better use of existing transmission capacity. Technologies such as dynamic line rating and reconductoring can raise the carrying capacity of existing lines, buying time while new transmission projects catch up.
  4. Demand-side flexibility. Shifting flexible loads, industrial processes, irrigation, EV charging, toward daylight hours reduces the mismatch from the demand side rather than relying on storage alone.

None of these are exotic technologies. As the Ember report on transmission curtailment put it, the technical pieces are largely in place. What is missing is the pace of execution and the regulatory framework to move faster.

Frequently Asked Questions

Why is solar power being wasted if India still needs more electricity?

Because the timing does not match. Solar output peaks at midday when demand is comparatively low, and demand peaks in the evening when solar generation has already dropped to zero. Without enough storage to bridge that gap, surplus midday power has nowhere useful to go.

Analysts estimate that flattening even half of a typical evening demand ramp would require about 130 GWh of battery discharge across a single afternoon-to-evening window, compared with the roughly 24 GWh the entire national storage fleet discharged on an average day in May 2026.

No, but those states feature heavily in the data because their solar capacity has scaled faster than transmission and storage infrastructure. The southern grid, by comparison, has shown far better synchronisation between generation growth and grid readiness.

Most likely in the near term. India’s solar capacity additions are continuing at pace, cumulative renewable capacity crossed 282 GW by May 2026, while battery storage capacity, though growing, remains well below the levels the National Electricity Plan projected for this period.

The Bigger Picture

India’s renewable energy story is still, on balance, a success story. Solar capacity has grown from 58 GW in 2020-21 to over 157 GW by May 2026. But curtailment numbers like 747 GWh in a single month are a reminder that generation capacity alone does not solve the energy problem. What happens between the moment power is generated and the moment it is actually consumed now matters just as much as how much of it India can produce.

The next phase of India’s solar growth will likely be judged less by how many gigawatts get installed, and more by how much of that generation the grid can actually put to use.

Yushmita

RECENT POSTS

CATEGORIES

Leave a Reply

Your email address will not be published. Required fields are marked *

At Solar Journal Hub, is to empower you with the knowledge to choose the ideal solar solution for your requirements. Let’s embark on your journey to a brighter, more sustainable future!

USEFUL LINKS

Copyright Solar Journal Hub. 2025

WhatsApp Icon